
Making the Data Work for You
In today’s data-driven world, understanding and visualizing data has become more essential than ever for businesses. Looker Studio (formally Google Data Studio) is a powerful tool for turning complex data into informative, easy-to-read, customizable dashboards and reports. Whether you’re creating simple dashboards or looking for deeper insights, this comprehensive guide will show you how to leverage Looker Studio to its fullest potential.
What Is Looker Studio?
Looker Studio is a free tool that transforms your data into compelling visualizations. With an intuitive drag-and-drop report editor, you can create stunning charts, graphs, and tables that bring your data to life. From line and bar charts to geo maps and pivot tables, Looker Studio offers a wide range of customizable data visualization options.
Why Is Data Visualization Important?
Data visualization helps to simplify complex data sets, allowing you to recognize patterns, trends, and outliers with ease. By visualizing your data, you can quickly understand the story it tells and make informed decisions. Looker Studio enables you to communicate your data effectively, impel data-driven decision-making, and gain actionable insights.
How Are These Tips Going To Help You?
In this article, we will walk you through a series of techniques to maximize your use of Looker Studio. From segmenting data to combining multiple data sources, filtering across these sources, and creating templates, we will guide you every step of the way. Let’s dive in!
Launching Performance Power
For the purposes of this article, let’s invent a company; we’ll call it Big Important Business. Now, Big Important Business is running lead generation initiatives all across the globe, in different languages, for different brands, spread out over several accounts. They are running ads on the Meta and Google networks and have two accounts for each, corresponding to regional management divisions, and would like comprehensive reporting to reflect their whole business. They want to see performance segmented by channel, location, campaign type, and brand in their report—and that’s where we come in!
Before We Begin…
It may seem daunting to achieve such a report, but luckily, we’ve set up both ad accounts with the naming structure that will aid our efforts. By including the campaign type, brand, language, and location in each campaign name, we will be able to segment the data properly.
For example, a nonbranded search campaign running for Brand 1 targeted at Spanish speakers in Mexico would look like this: NonTM – ‘Mexico’ – [Brand 1] – Spanish.
We’ll get to the details of formatting your campaign names in the sections ahead.
Segment Data With Regular Expressions or “Regex”
Segmenting data is crucial for gaining granular insights and understanding specific subsets of your audience. We will explore the power of regular expressions (regex) and how they can be used to segment your data effectively. Learn how to segment based on multiple locations or campaign types and discover the potential of regex in dimension segmentation using CASE statements. To review the different types of regex, visit this guide: Examples of Regular Expressions.
CASE Statements
Let’s say you want to segment your table by campaign type; since the type is already in the campaign name, we can easily create a new calculated field that will divide up your campaigns accordingly with the help of regexp_contains and a CASE statement. A case statement is much like an if/then statement and is a set of rules to sort your data into specific subsets.
For example, when the following CASE statement is placed in a calculated field, it will create a dimension that lists every campaign type we include:
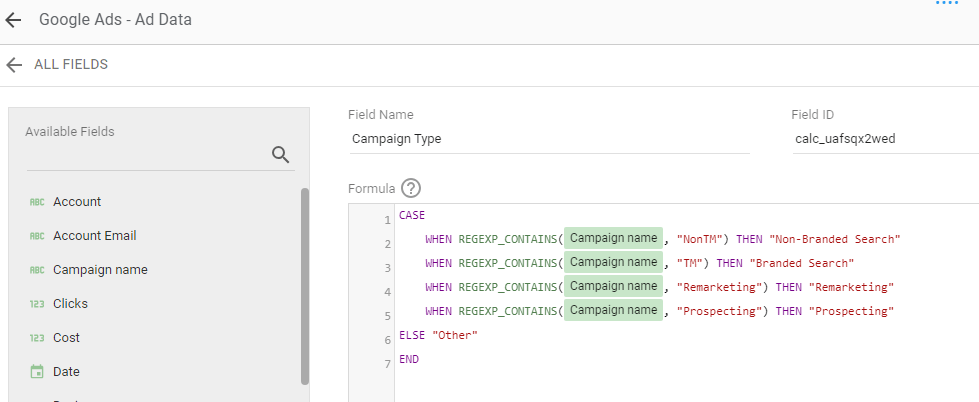
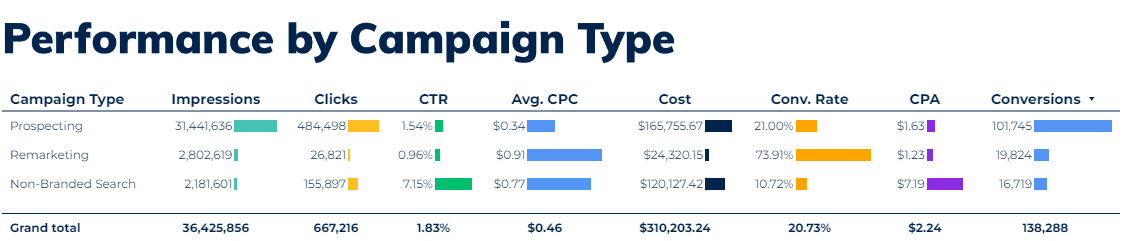
When inserted into a table, this formula allows you to see each of the types’ performance as an individual line-item:
Extracting Text From a String
At this point, you may be wondering why there are apostrophes placed around the targeted country in the campaign names. Here’s why: we can use REGEXP_EXTRACT to pull the location names dynamically and effectively segment the data.
When placed in a calculated field, this formula:
REGEXP_EXTRACT(Campaign name, “‘(.*?[^’]*)”)
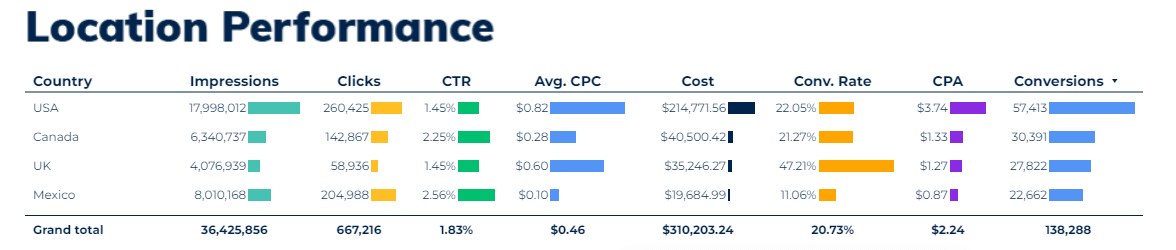
will segment the data by what’s in between the first two apostrophes, without needing to update it when new segments are added to the account like you would in the CASE segmentation previously outlined. So a campaign name such as “NonTM Search – ‘Mexico’ – [Brand 1] – Spanish” would show up in tables as “Mexico.”
Combine Multiple Data Sources
Often, businesses need to combine data from different sources to gain a comprehensive view. Looker Studio allows you to blend data seamlessly so you can filter for certain goals or combine data from different sources. So let’s walk you through understanding join keys, types of joins, and best practices for combining data accurately.
Why Would You Need To Blend Data?
Let’s say that your account has multiple goals set up, but you want to track only one. To do this, you would need to blend the data source with itself and add a filter for your desired goal. This way, you can display complete campaign information combined with the chosen goal.
Another reason to combine data is for the purpose of visualizing the business’s comprehensive performance across multiple channels, such as Meta and Google Ads. Blending the two data sources allows you to see the business’s total performance within one table or chart.
Understanding Join Keys
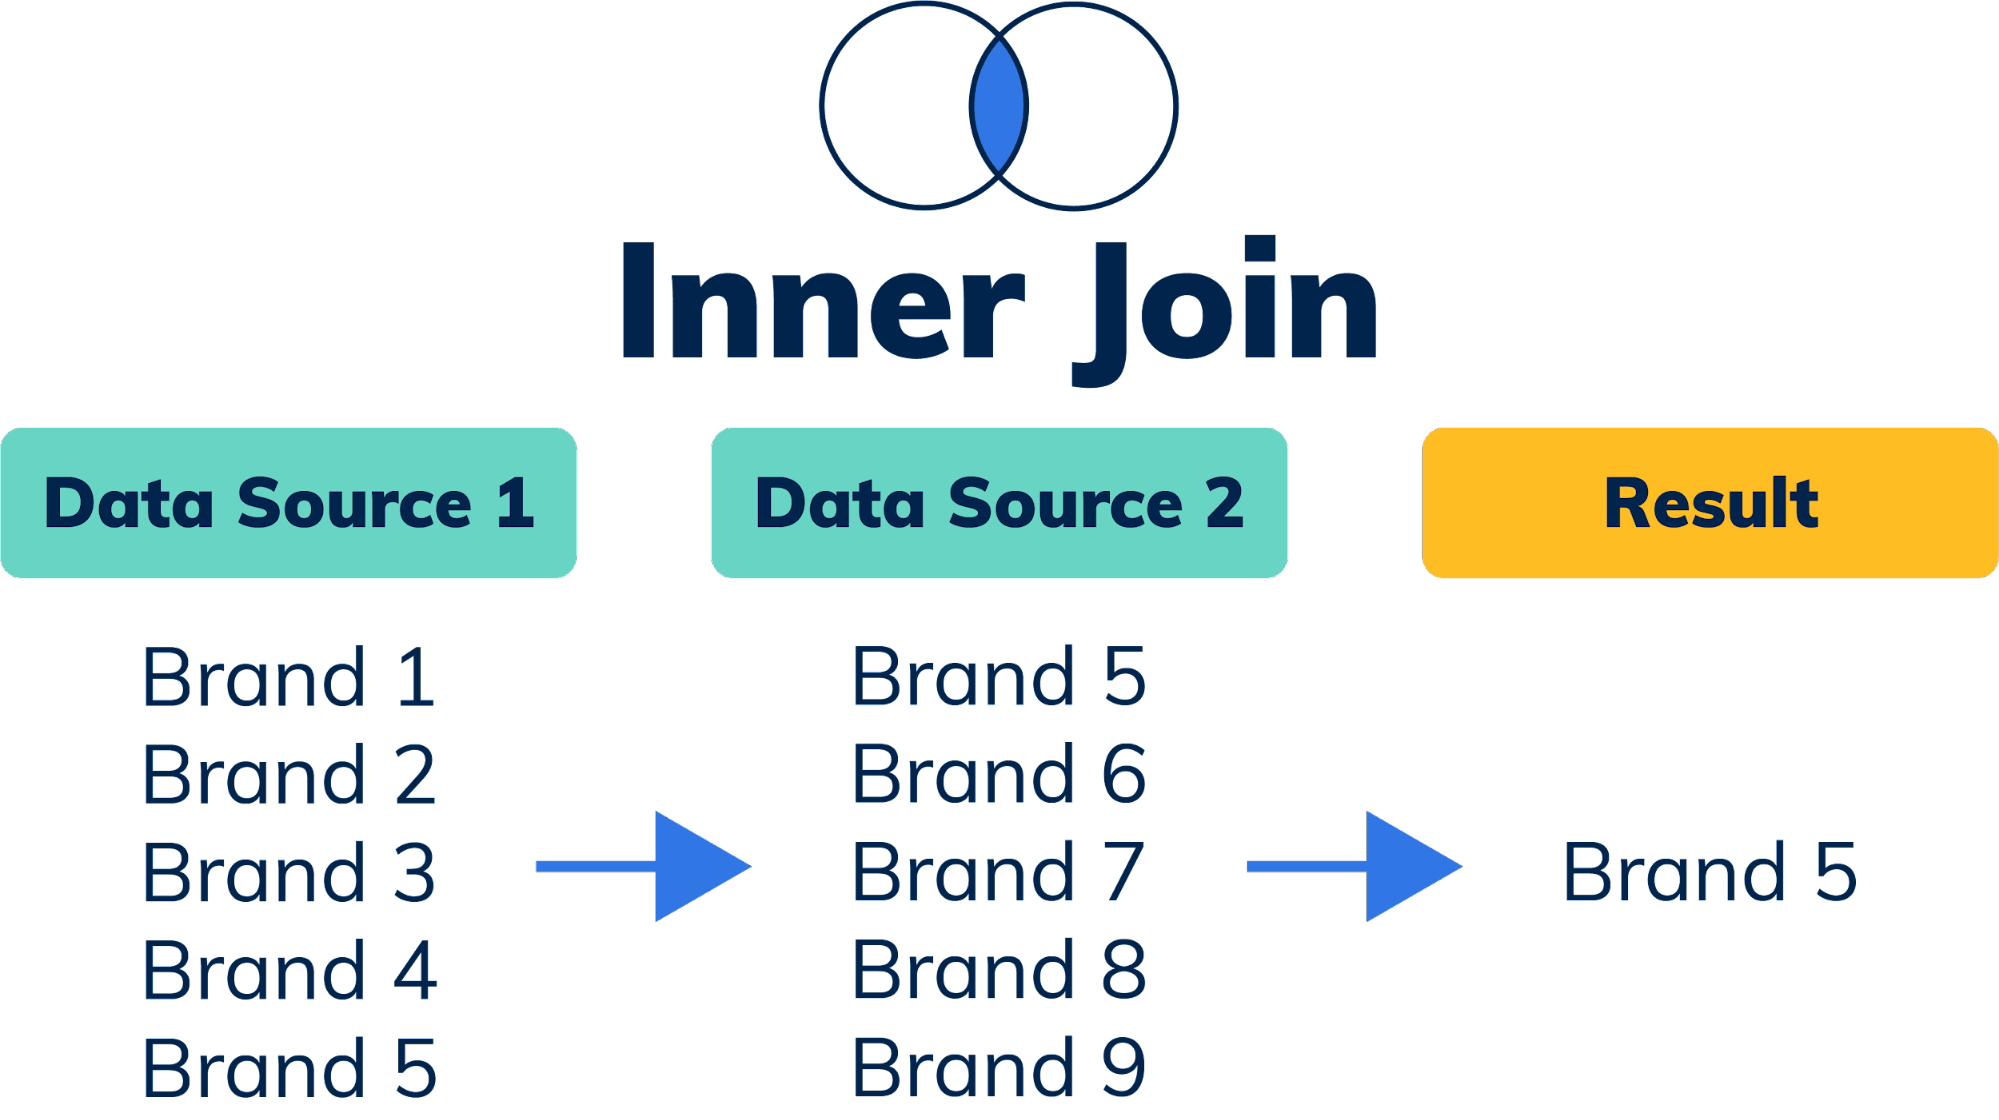
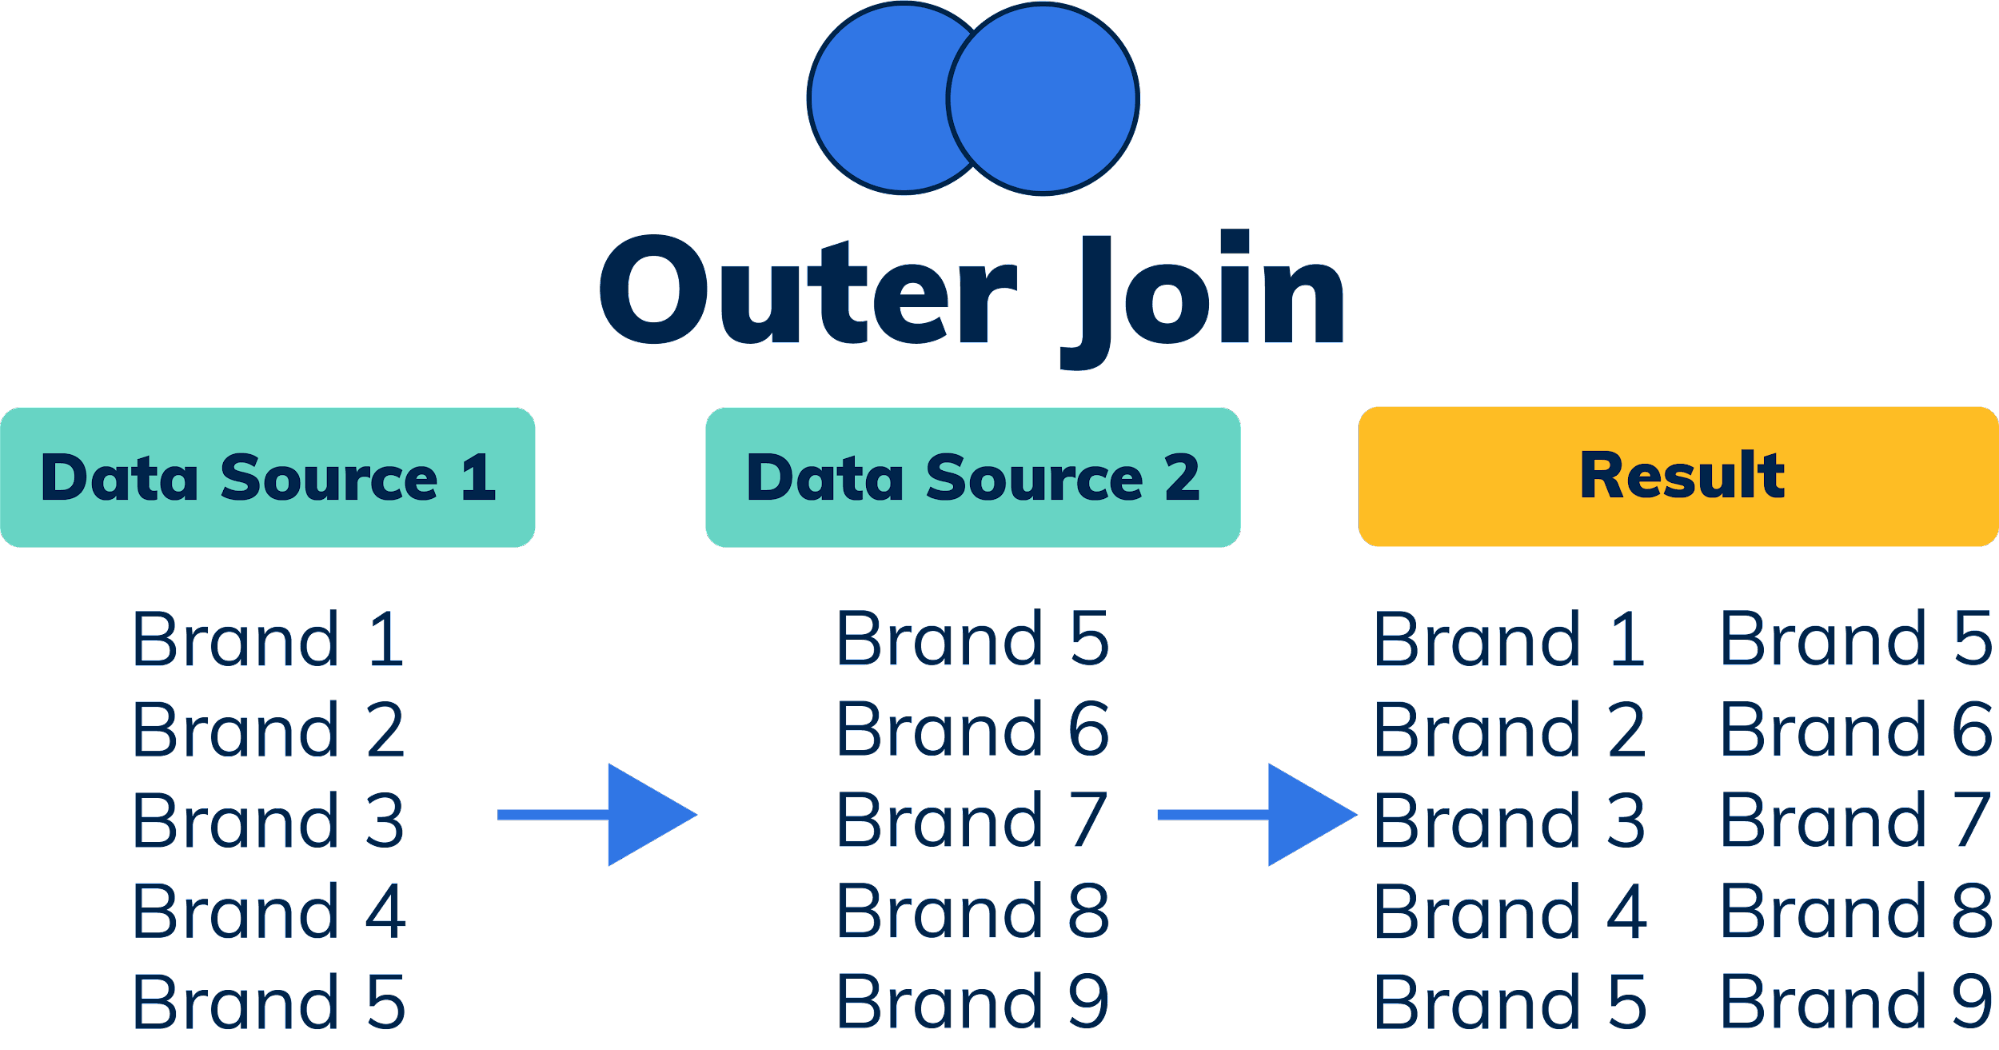
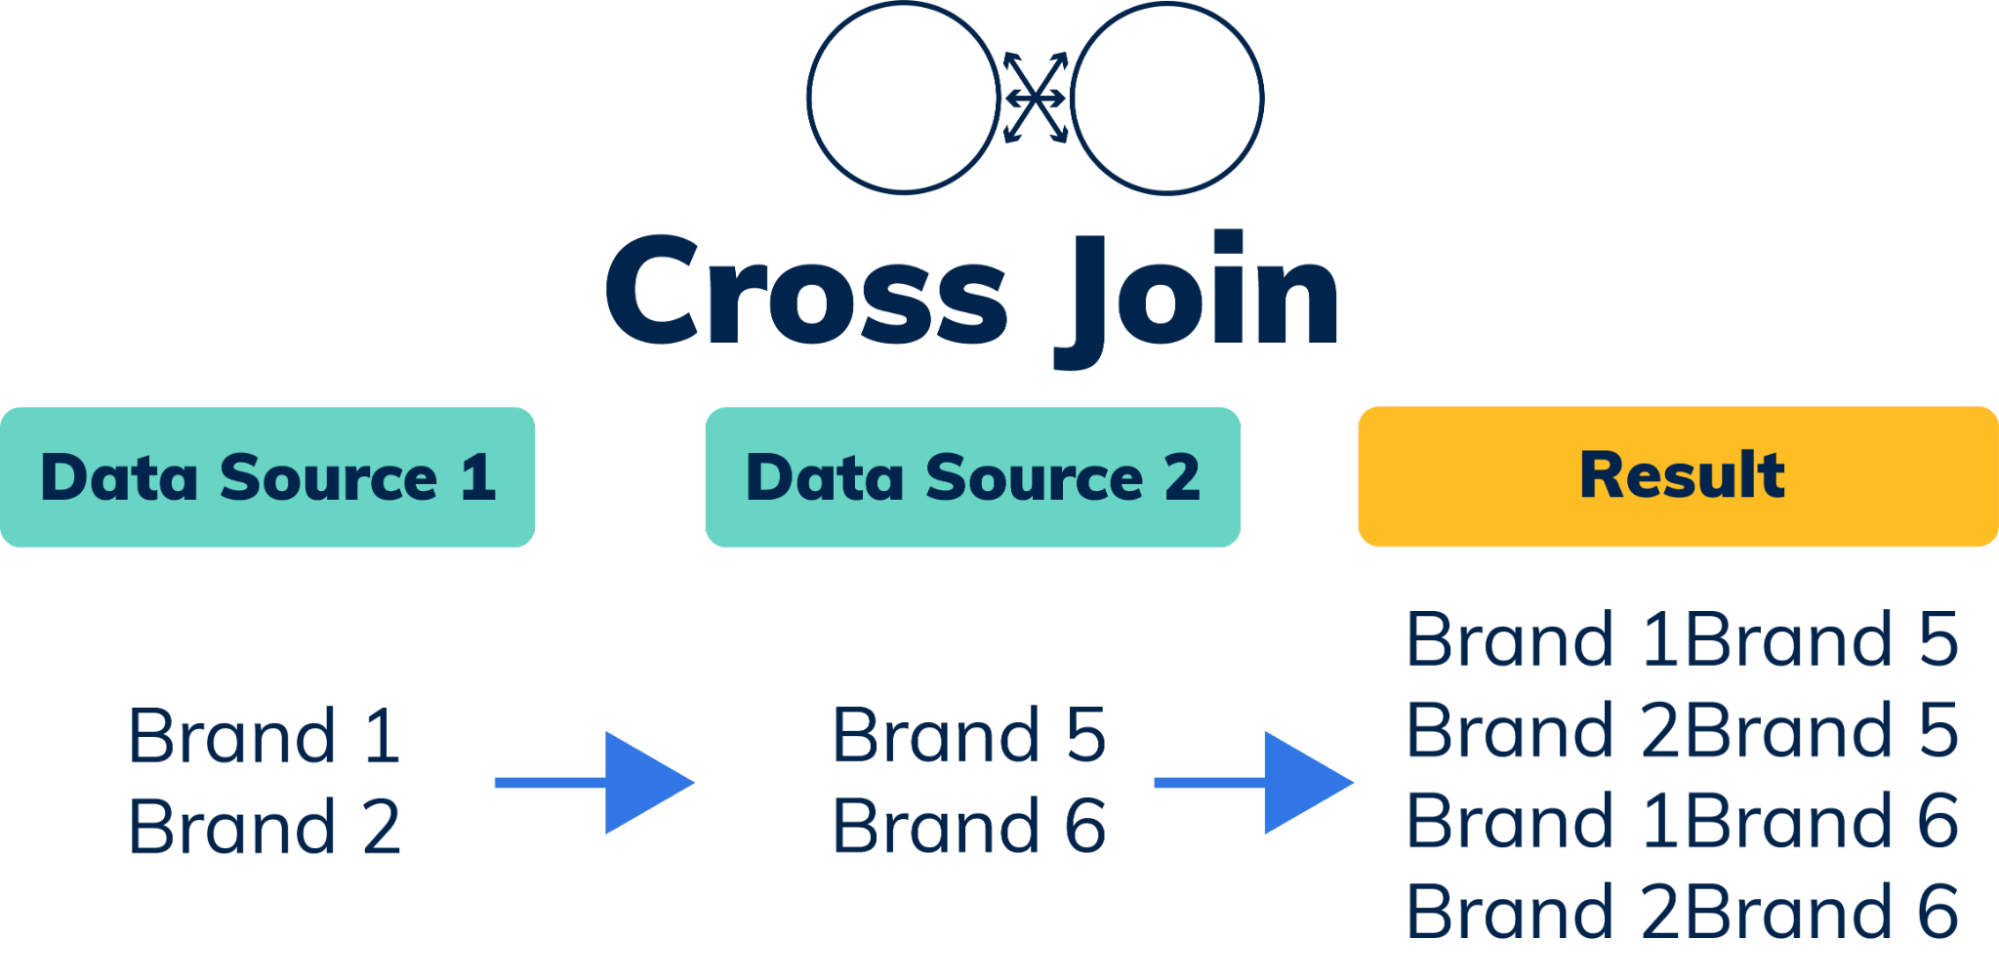
Before we explore a data blending example, first we need to understand how we are combining it. In Looker Studio, blending data requires you to join the sources together with either a Left, Right, or Full Outer join, an Inner join, or a Cross join operator.
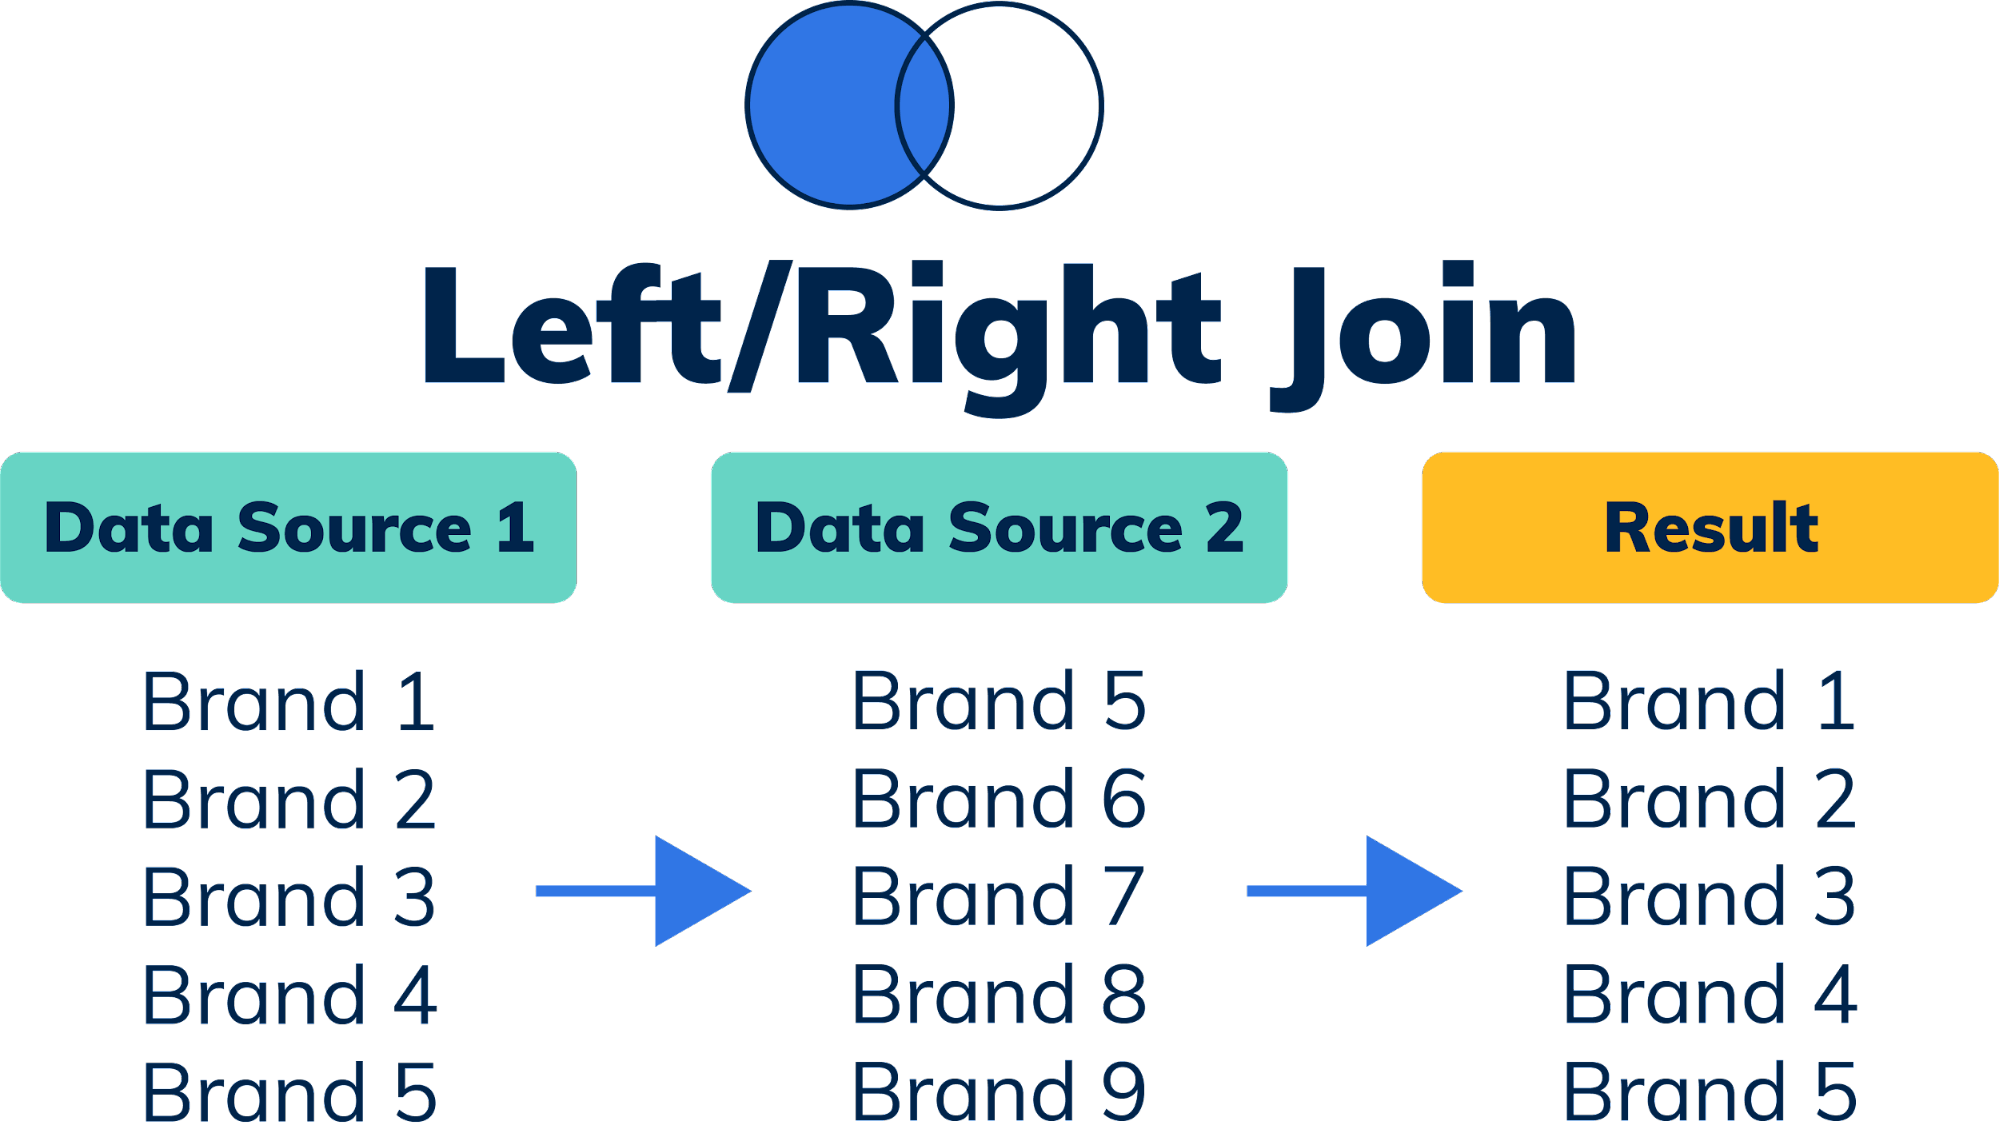
A left or right join will return all the data from the dimension on the left/right and only matching records from the other.
An inner join will only show what is in bothdatasets.
Full outer joins will return all the data in both sets of data and combine matching items.
Cross joins will generate the Cartesian product of the joined data and create a combination of all the ordered pairs in the data set.
Combining the Data: The Setup
Now that you have a grasp on the different ways of joining multiple datasets, let’s move on to setting up your blends for deployment. The first thing you will want to do is make sure that every dimension and metric share the same names. For example, if one data source calls campaigns “Campaign Name” and the other uses “Campaign”, change one so that they both match. This simple step will make it easy to combine the data later.
Blended data also requires you to use dates in the format they will be displayed. Unlike a single data source table that allows you to create date-views with a single date dimension like “Date”, blended data needs to have a dimension for each granularity included in the joined dimensions. For example, in order to show both year week and year month, both will need to be included in each data source in the blend.
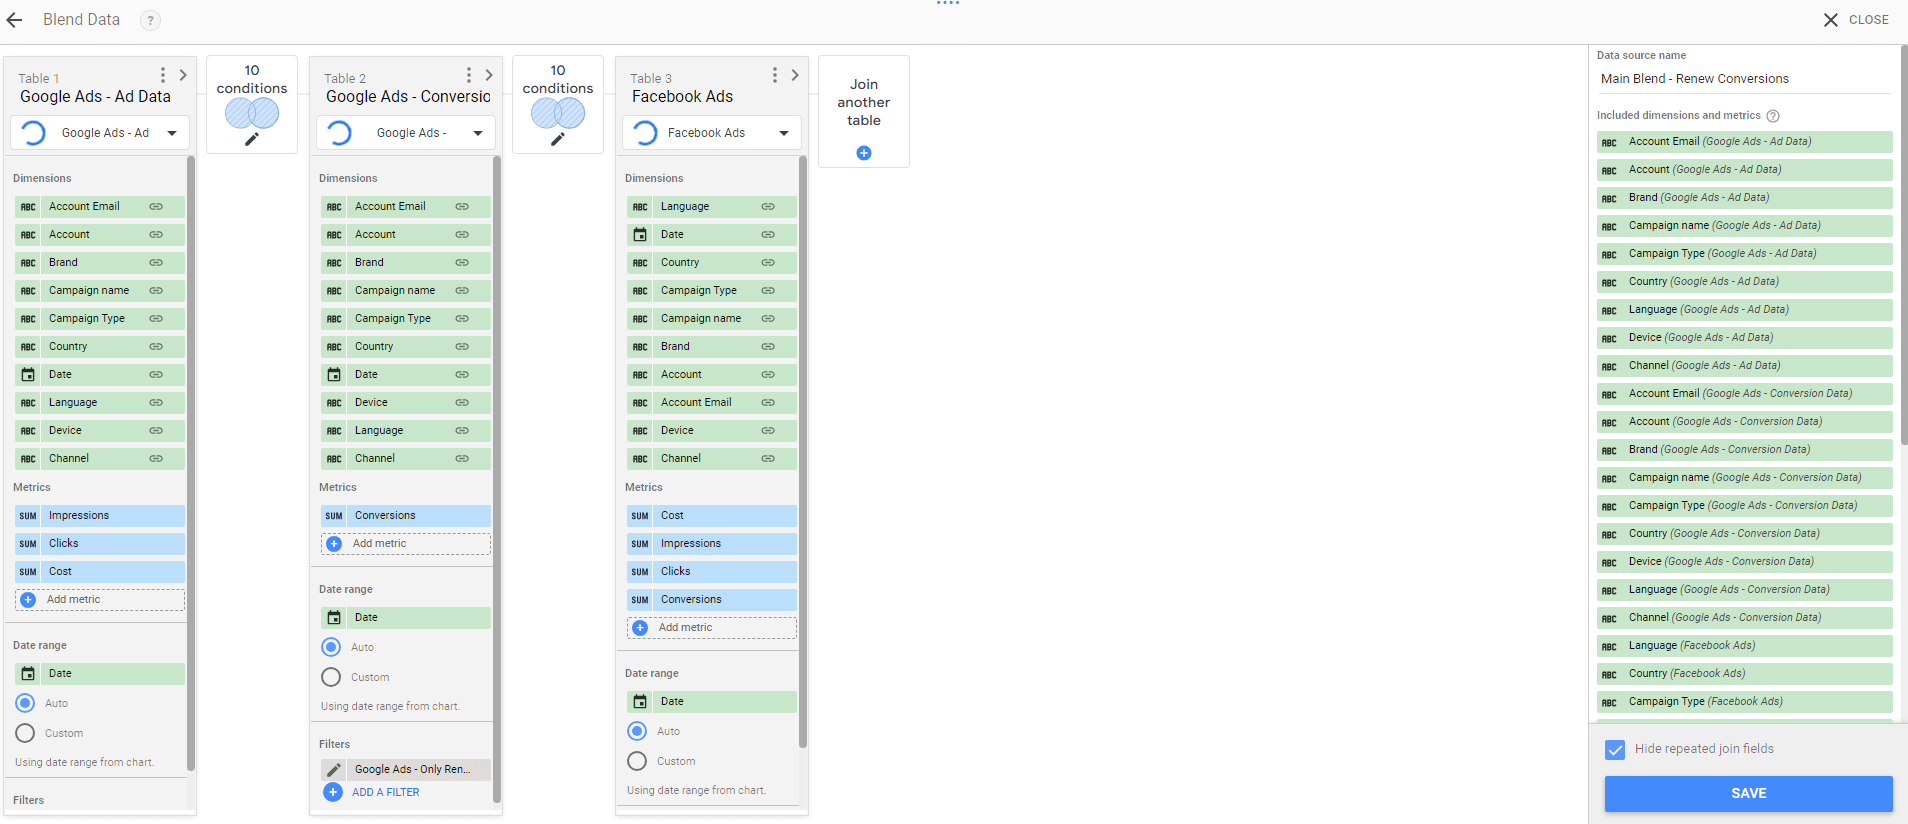
The last thing to do is to name each data source in the blend to better represent its contents. Leaving it blank will result in each being named “Table 1”, “Table 2”, etc. which will be confusing when you’re looking at the blend in a chart or table. Naming each blend based on the data source and metrics included will make it easier to combine the data in the next step. Your blended data source should look something like this:
Combining the Data: Execution
Combining metrics and dimensions via formulas and new fields can be difficult and laborious, so we created an easy-to-use building tool.
https://docs.google.com/spreadsheets/d/192eP9SZPczw3o23_InSl1muVP9aLQw5bLH1E6h4OQ0I/edit?usp=sharing
This is where all the setup you’ve done comes in handy. Follow the steps in the builder and add the formulas into new fields in your chart or table in Looker Studio. For example, if we were building a table to see the performance of campaign types across both data sources, we could copy the formula in the dimension cell, paste it into a new dimension field in the table, and then do the same for each metric.
Filtering Across Multiple Data Sources
Filtering data is essential for homing in on specific insights and to streamline your analysis process. Filtering across multiple data sources is possible when you set up custom dimensions and use drop-down filters.
Each dimension within a data source contains a unique field ID. This field ID can be matched with other dimensions in other data sources to create a cross-source filter. While default dimensions already have an assigned field ID, creating a custom field allows you to set it manually.
If you are trying to filter for a default dimension, simply create a new calculated field and enter the following formula:
CONCAT([Insert Default Field Name Here],””)
From here, copy the field ID, go to create another calculated field in your other data source, and paste it into the new field ID section.
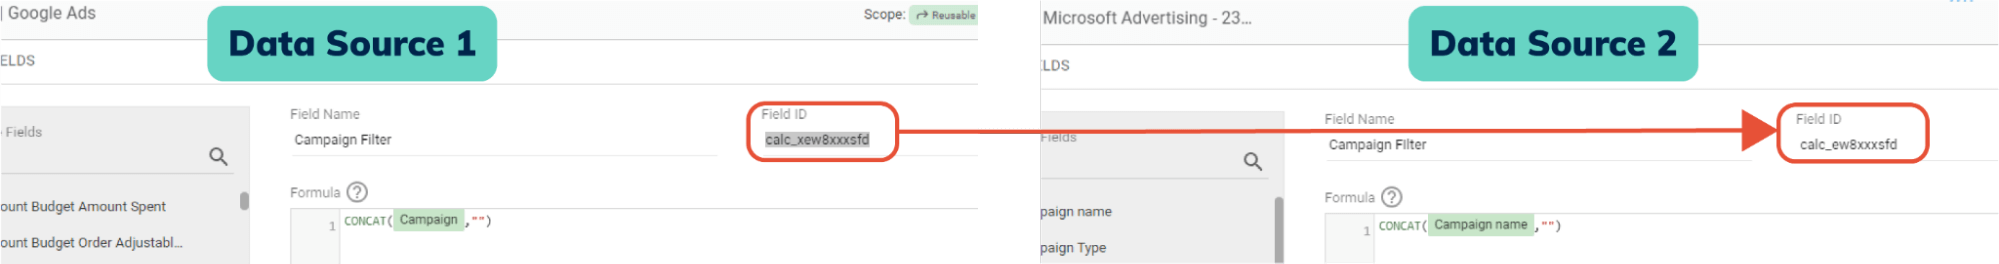
You can do this with any calculated dimension and add it to a filter control of your choosing and it will filter the data across every data source.
Create a Template for Yourself and Others
Save time and ensure consistency by creating templates and reports with universal access for any user within your organization. Empower your team and streamline reporting processes with this time-saving trick.
The first thing you will need to do before you can create templates is to switch your data source’s data credentials to “Viewer”. This will prevent users from seeing other folks’ data when they open the report.
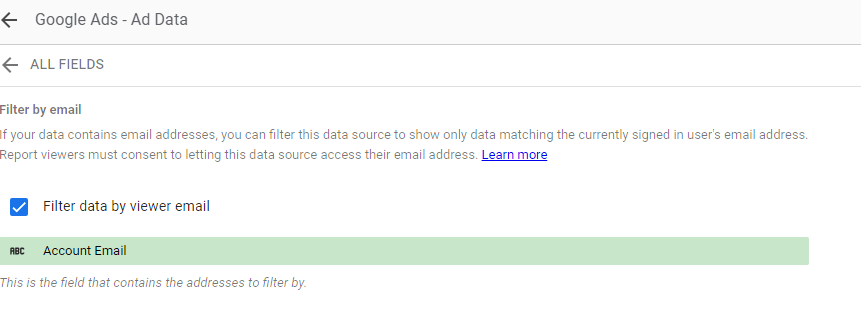
If you have an email field in your data source, you can limit access to the whole report based on what is provided. To do this, open your data source and click “Filter By Email”. Then, add your email field in the provided spot.
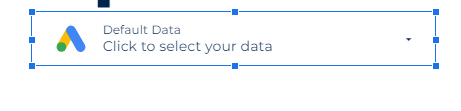
If you are using one of the native connections in Looker Studio, you can simply add a data source control that will allow the user to view only the accounts they have access to.
BONUS TIP: Spice It Up With Graphic Design Elements
Enhance the visual appeal of your reports with graphic design elements. Looker Studio offers various template themes and allows you to add images to break up the design and make your data stories even more captivating. Impress your stakeholders with visually stunning reports.
Utilize a Template Theme
- Keep your reports on-brand easily
Add Images To Break Up the Design
- Adding graphics can make your reports look more visually appealing for the audience
- Create a Presentation Deck
- Create a Scrolling Page mode
Looker Studio is a powerful tool that enables you to transform raw data into compelling visualizations. Whether you’re a beginner or an experienced user, this comprehensive guide will help you unlock the full potential of Looker Studio. From segmenting data to combining multiple data sources and filtering across them, to creating templates, Logical Position’s guide will empower you to tell impactful data stories and drive informed decision-making.
Remember, data visualization is not just about presenting numbers; it’s about conveying a story that sparks action. Start your journey with Looker Studio today and dive into the world of powerful data visualization.