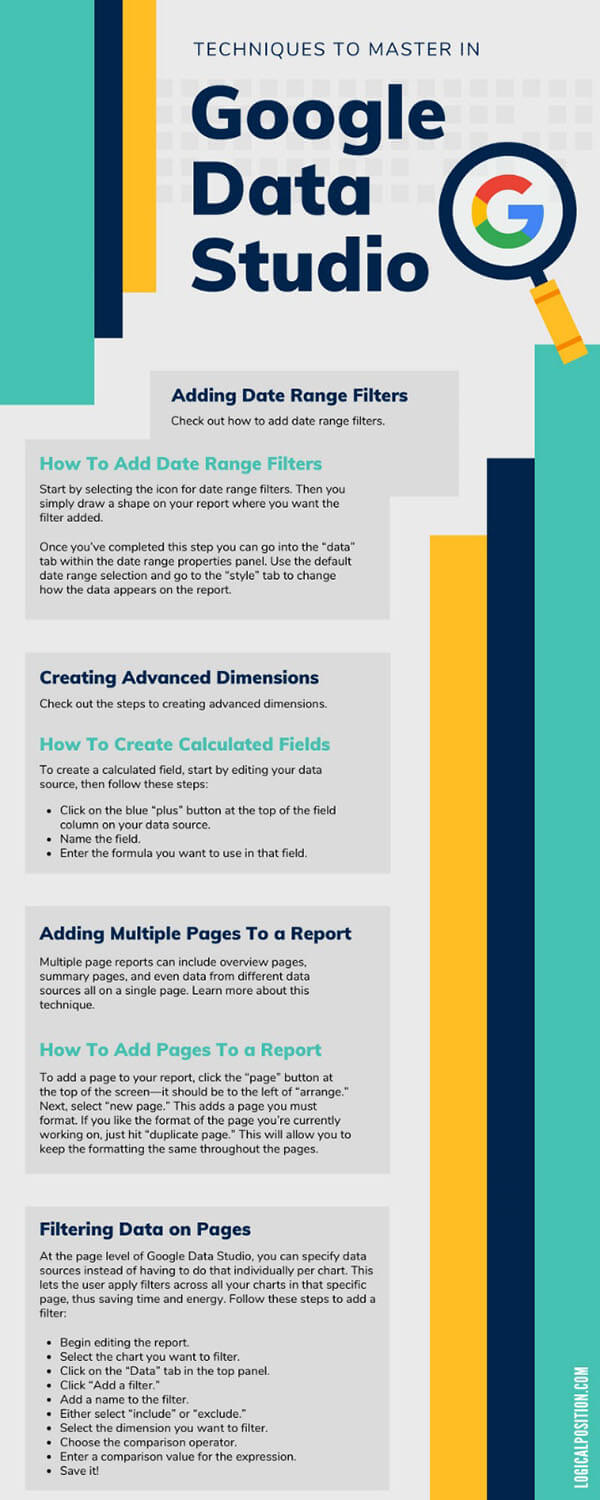
Google Data Studio is a complimentary tool Google provides to businesses. It is a tool used to make data sets easy to comprehend, share, and even lets companies design custom dashboards and reports. This is a fundamental tool for any business that invests in digital marketing. Check out the most important techniques to master in Google Data Studio for your business.
Adding Date Range Filters
When you want to see how a campaign is performing in a certain time frame, the best technique to use in Google Data Studio is the adding of date range filters. Check out how to add date range filters, some common issues, and how to avoid them.
How To Add Date Range Filters
Start by selecting the icon for date range filters. Then you simply draw a shape on your report where you want the filter added.
Once you’ve completed this step you can go into the “data” tab within the date range properties panel. Use the default date range selection and go to the “style” tab to change how the data appears on the report.
This process is similar to how it works in Google Analytics, if you’re familiar with that tool. You can choose from many predefined options such as the past seven days or the past quarter. You’re also able to completely customize the date range of the data.
Troubleshooting Tips
Mistake: Adding the date range filter to the entire page, rather than just a few elements.
Fix it: Group the elements together that you want to apply the filter to by selecting all the charts that you want to group. Right click on the set and click “Group.” Then, the date filter will only apply to that group.
Creating Advanced Dimensions
In Google Data Studio, you can add advanced reporting elements by using different formulas—this is also called calculated fields. These fields let you manipulate the data. Check out the steps to creating advanced dimensions and common issues you can fix.
How To Create Calculated Fields
To create a calculated field, start by editing your data source, then follow these steps:
- Click on the blue “plus” button at the top of the field column on your data source.
- Name the field.
- Enter the formula you want to use in that field.
This process simply creates the field; to start using it you must apply it to a row of data within a chart. There are two types of calculated fields:
Calculated Fields In Data Sources
When creating a calculated field in data sources, you can make it available in any report that uses that specific data source. It’s also useable in charts and controls, just like a regular field. These can be filtered and manipulated similar to a regular field.
The downside of a calculated field in data sources is that it cannot be used with blended data and it’s required to have editing ability to edit calculated fields.
Chart-Specific Calculated Fields
Chart-specific calculated fields can do math, use function, and do other things that calculated fields in data sources can do, but they also come with some special features:
- The ability to add fields without editing abilities of the data source.
- Working with blended data.
- Can incorporate data source calculated fields.
Overall, chart-specific calculated fields offer more than calculated fields in data sources, but there are still limitations:
- They are only usable in the chart they were created in—they don’t apply to the chart’s data source.
- You must enable Field Editing in Reports in the data source to use them.
- They can only be created by editors of the report.
Adding Multiple Pages To a Report
Within a single report using Google Data Studio, you are able to see different data types through the use of pages. Multiple page reports can include overview pages, summary pages, and even data from different data sources all on a single page. Learn more about this technique.
How To Add Pages To a Report
To add a page to your report, click the “page” button at the top of the screen—it should be to the left of “arrange.” Next, select “new page.” This adds a page you must format. If you like the format of the page you’re currently working on, just hit “duplicate page.” This will allow you to keep the formatting the same throughout the pages.
To include the new page in your report, click on “Current Page Settings.” Then, click on “Select Data Source” so you can scroll to see all of the integrated data sources and add them to the page settings.
Filtering Data on Pages
At the page level of Google Data Studio, you can specify data sources instead of having to do that individually per chart. This lets the user apply filters across all your charts in that specific page, thus saving time and energy. Follow these steps to add a filter:
- Begin editing the report.
- Select the chart you want to filter.
- Click on the “Data” tab in the top panel.
- Click “Add a filter.”
- Add a name to the filter.
- Either select “include” or “exclude.”
- Select the dimension you want to filter.
- Choose the comparison operator.
- Enter a comparison value for the expression.
- Save it!
This process should allow you to create filters on pages for certain data charts and sets. You also have the ability to edit the filters using the following process:
- Begin editing the report.
- Select the function that the filter is applied to.
- Click edit.
- Make the changes you want and click “Save” when you’re finished.
There are countless techniques to master in Google Data Studio. With such a vast variety of techniques and abilities, this tool is one of the most beneficial to a digital marketing campaign. At Logical Position, we use Google Data Studio in addition to our own dashboard reporting tools for all of our campaigns across our services.
Contact Logical Position today to learn more about our Google Ads lead generation, among other services. As a Google Premier Partner agency, we pride ourselves on transparency and our conversion-based approach to digital marketing.